Clik here to view.

A look behind the numbers at the Canucks scoring troubles. Using advanced analysis or principles, the teams' historical performances for even strength and power play goals scored are charted, compared and evaluated. And, a surprising conclusion is discovered?!
The Canucks are in a slump. They simply cannot score enough goals. They have just 6 goals in their last 5 games. They currently sit in 9th place in the very competitive Western Conference and are out of a playoff position . Predictably, the local radio airwaves are filled with 'Chicken Littles' already proclaiming the end of Vancouver's playoff run.
So, just how desperate is Torts and his coaching staff? I wonder, would they consider an 'old school' tool that former coach Alain Vigneault once himself pondered using when the team faced a similar drought back in 2007? Hmmm......
>>>>>>
Image may be NSFW.
Clik here to view. {from DirtyDangle.com)
In the meantime, let's take a look behind the numbers at the Canucks scoring. As always we will use advanced analysis or principles. However, this time we will be only looking at traditional stats. I will use the straightforward,- 'goals scored'. And, for a change, I won't use any advanced stats.
The first step is to make a significant distinction between power play scoring and even strength scoring (or non-powerplay scoring). Of course, these are clearly two different game stats and need to be treated as such.
Secondly, many analysts will often state, "This team has been awful!" Or, "That team has been great!". However, we need to first define precisely and numerically just what 'awful' or 'great' performances mean in the context of (ES) scoring that we are evaluating. So let us familiarize ourselves with objective and accurate baselines.
My approach is simple. I have created five buckets.
RANKING | % |
ELITE | Top 5% |
GOOD | Top 35% |
AVERAGE | Top 50% |
BAD | Bottom 35% |
AWFUL | Bottom 5% |
{Those of you familiar with statistics will recognize that I have simply used standard deviations from the mean. 'Good', for example, is +1 standard deviation.' Elite' is +2 SD's, Bad is -1 SD's, and 'Awful' is -2 SD's}.
We can now use these baselines to get a framework for accurate and meaningful evaluations. We will use historical data form 2006 - present.
Image may be NSFW.
Clik here to view.
- 'Average' teams traditionally score just under 2 goals/gm. at even strength).
- The difference between a 'bad' team and a 'good' team is close to .4 goals/gm.
- Basically, an increase of .2 goals/gm. moves a team up or down a level.
- Finally, STL 2007 and WSH 2010 are the two teams that provide the upper and lower bounds.
Now let us look at this years performance so far in the Western Conference.
Image may be NSFW.
Clik here to view.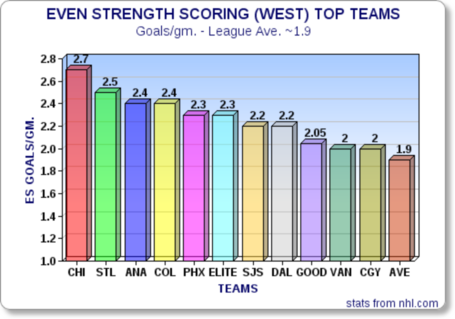
- The Canucks are solidly between average and good in the ES scoring department.
- There are currently five teams above the 'elite' level.
- No surprise, the Chicago Blackhawks are leading this year, and are on a historic pace.
- Canucks' fans can take some comfort in the fact that we would usually expect only ~5% of teams to finish the season at or above the 'elite' level. (1-2 teams a year).
- This means regression to the mean is bound to happen for 3 or 4 teams out of: STL, ANA, COL, PHX, and CHI.
Let's take a quick look at the bottom group of teams.
Image may be NSFW.
Clik here to view.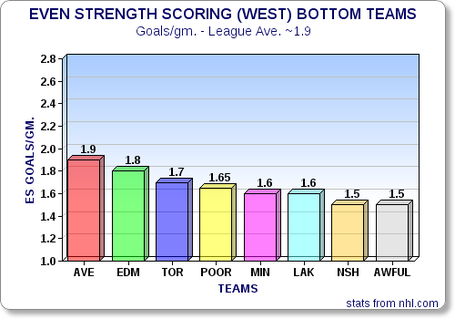
- The Los Angeles Kings and the Wild are succeeding with rates well below the Canucks.
- The Toronto Maple Leafs are another example of a team that is winning with a below average goal scoring at (ES).
Next, we need to compare the current Canucks' scoring performance to past teams to determine to what extent the team 'have' or 'have not' met reasonable expectations this year.
Image may be NSFW.
Clik here to view.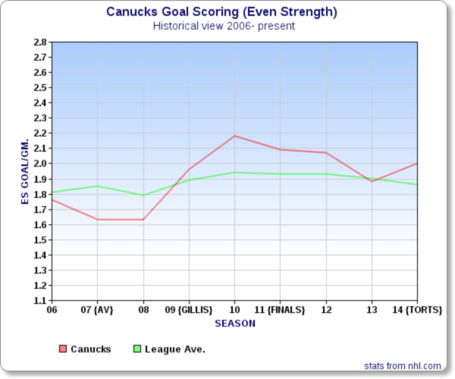
- The Canucks ('06-'08) under Alain Vigneault were well below average in (ES) scoring.
- Under GM Mike Gillis, the team has showed dramatic and sustained improvement.
- The Canucks dipped down last year in the shorter season but have appeared to bounce back.
- The Kesler injury last year was a significant factor.
- Given the teams' prior three year history, from 2006-2008, it has been an achievement that Vancouver has not dipped below average in the last five years.
Image may be NSFW.
Clik here to view.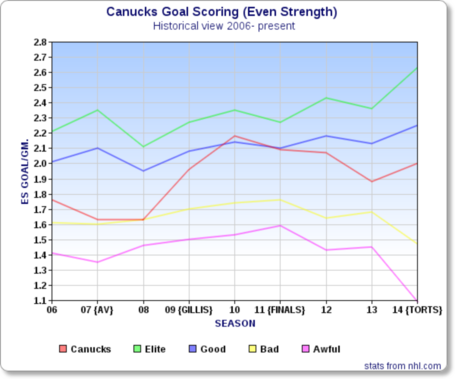
- I have added to the chart the baselines - {elite, good, bad, awful}.
- Wow! The Canucks have never been an elite offensive scoring team at even strength.
- In fact,even in the dream season of 2011, the team had only a 'good' rating.
- Moreover, the Canucks were only a 'good' scoring team for 2/5 years (2010 and 2011).
- The numbers and the implications of this chart really needs to be digested!
- It really helps to explain the disappointment with the current team's lack of scoring.
- When people ask, "What has happened to the elite Canucks who were #1 in the league only two short years ago?"
- There is clearly an incorrect belief behind these expectations.
- From an (ES) scoring perspective, the difference between 2011 & 2014 is only .1 goal / gm.
- The 2014 Cancuks (ES) goal production represents just a 5% decrease from the 2011 'league leading' squad.
- Or, to put it another way, it equates to only : 2 (ES) goals every 20 games.
Conclusion:
Even strength goal scoring has had a minimal contribution to the Canucks downfall over the last 2 years!
Image may be NSFW.
Clik here to view.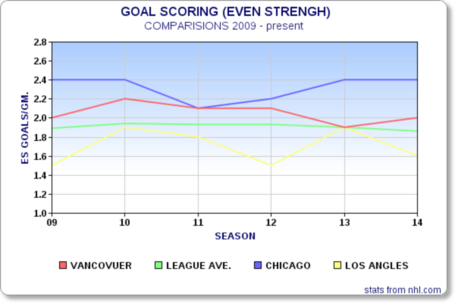
- Let's look at two other teams, the Chicago Blackhawks and the Los Angeles Kings.
- The Hawks are clearly an 'offense-first' team.
- The Kings are a 'defensive-style' team.
- The Canucks did manage to be even with Chicago for two seasons.
- However they are now far away from the Hawks.
- And, the Kings have moved closer to Vancouver the last few years.
- (Although, with the injury to Jeff Carter the Kings have fallen back in ES scoring so far this season).
- However, the changes noted above are primarily because of the Hawks' & the Kings' improvement and not because the Canucks have significantly decreased.
- The Canucks have been significantly above the Kings in ES scoring for most of five years.
- The Kings have won a cup and made it to the conference finals with average to below average (ES) goal scoring .
At the beginning of the article we made an distinction between even strength and power play scoring. Let us conclude our examination of the Canucks' scoring troubles by looking at their power play scoring.
Image may be NSFW.
Clik here to view.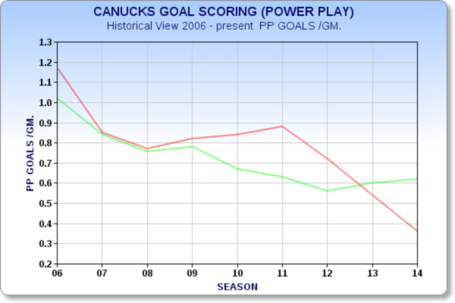
- Ugly! ..Ugly!..Ugly!
- Would you buy shares in this stock?
- They say: "A picture IS worth a thousand words".
- The Canucks power play scoring has dropped ~ 65% ! (since 2011).
- During this time period, the league average rate has dropped only ~3% .
One more comparison graph.
Image may be NSFW.
Clik here to view.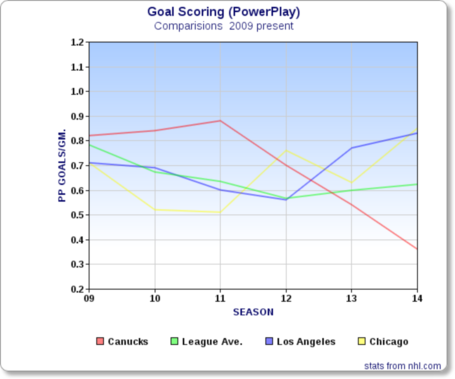
- Perhaps, a little good news for Canuck fans.
- The Kings have managed to win one cup with an average power play .
- Meanwhile, the Hawks have won two cups: one with below average power play production and the other with average power play production.
Summary
Of course, most fans are rightly worried about the Canucks' scoring woes. However, we have clearly seen that Vancouver has never been an elite scoring team at even strength. In fact, their highest ranking in the last five years was ~ 66 (PCT), or what we have characterized as only a 'good' (ES) scoring team. And, this year they are very close to that expected level. The team has not added significant offensive skill to the roster. Most importantly, with the core of the team aged 28-33, I contend that it is unreasonable to expect the Canucks to score above a 'good' level at ES this year.
Expectations are a strange animal? The 2011 season was intoxicating fro the city of Vancouver. So much so they never really realized the 'way' their team was so successful?! Still, even with all the criticism, in terms of (ES) scoring there is only a 5% difference between 2011 and this years' team. ! In contrast, the Canucks' powerplay amounts for 65% of the decrease in scoring.That leaves ~30% of the team's decrease in goal differential to account for.
In part 2, I will do just that, and look at even strength goals against & shorthanded goals against.
Finally, in part 3, I will look at the Canucks' historical goaltending / sve.% numbers and possession metrics.
Then we can clearly and accurately explain why the Canucks have fallen from - "the #1 President Trophy Team' - often described as having their "Window Wide Open" -- to the current - 'Middle of the Pack Team' - "with their "Window Closed Shut".
Thanks for reading. Feel free to add your comments below!